How to Monitor PC Performance While Gaming: FPS, Temps & Fixes
How to Monitor PC Performance While Gaming: Track FPS, Temps & Fix Bottlenecks
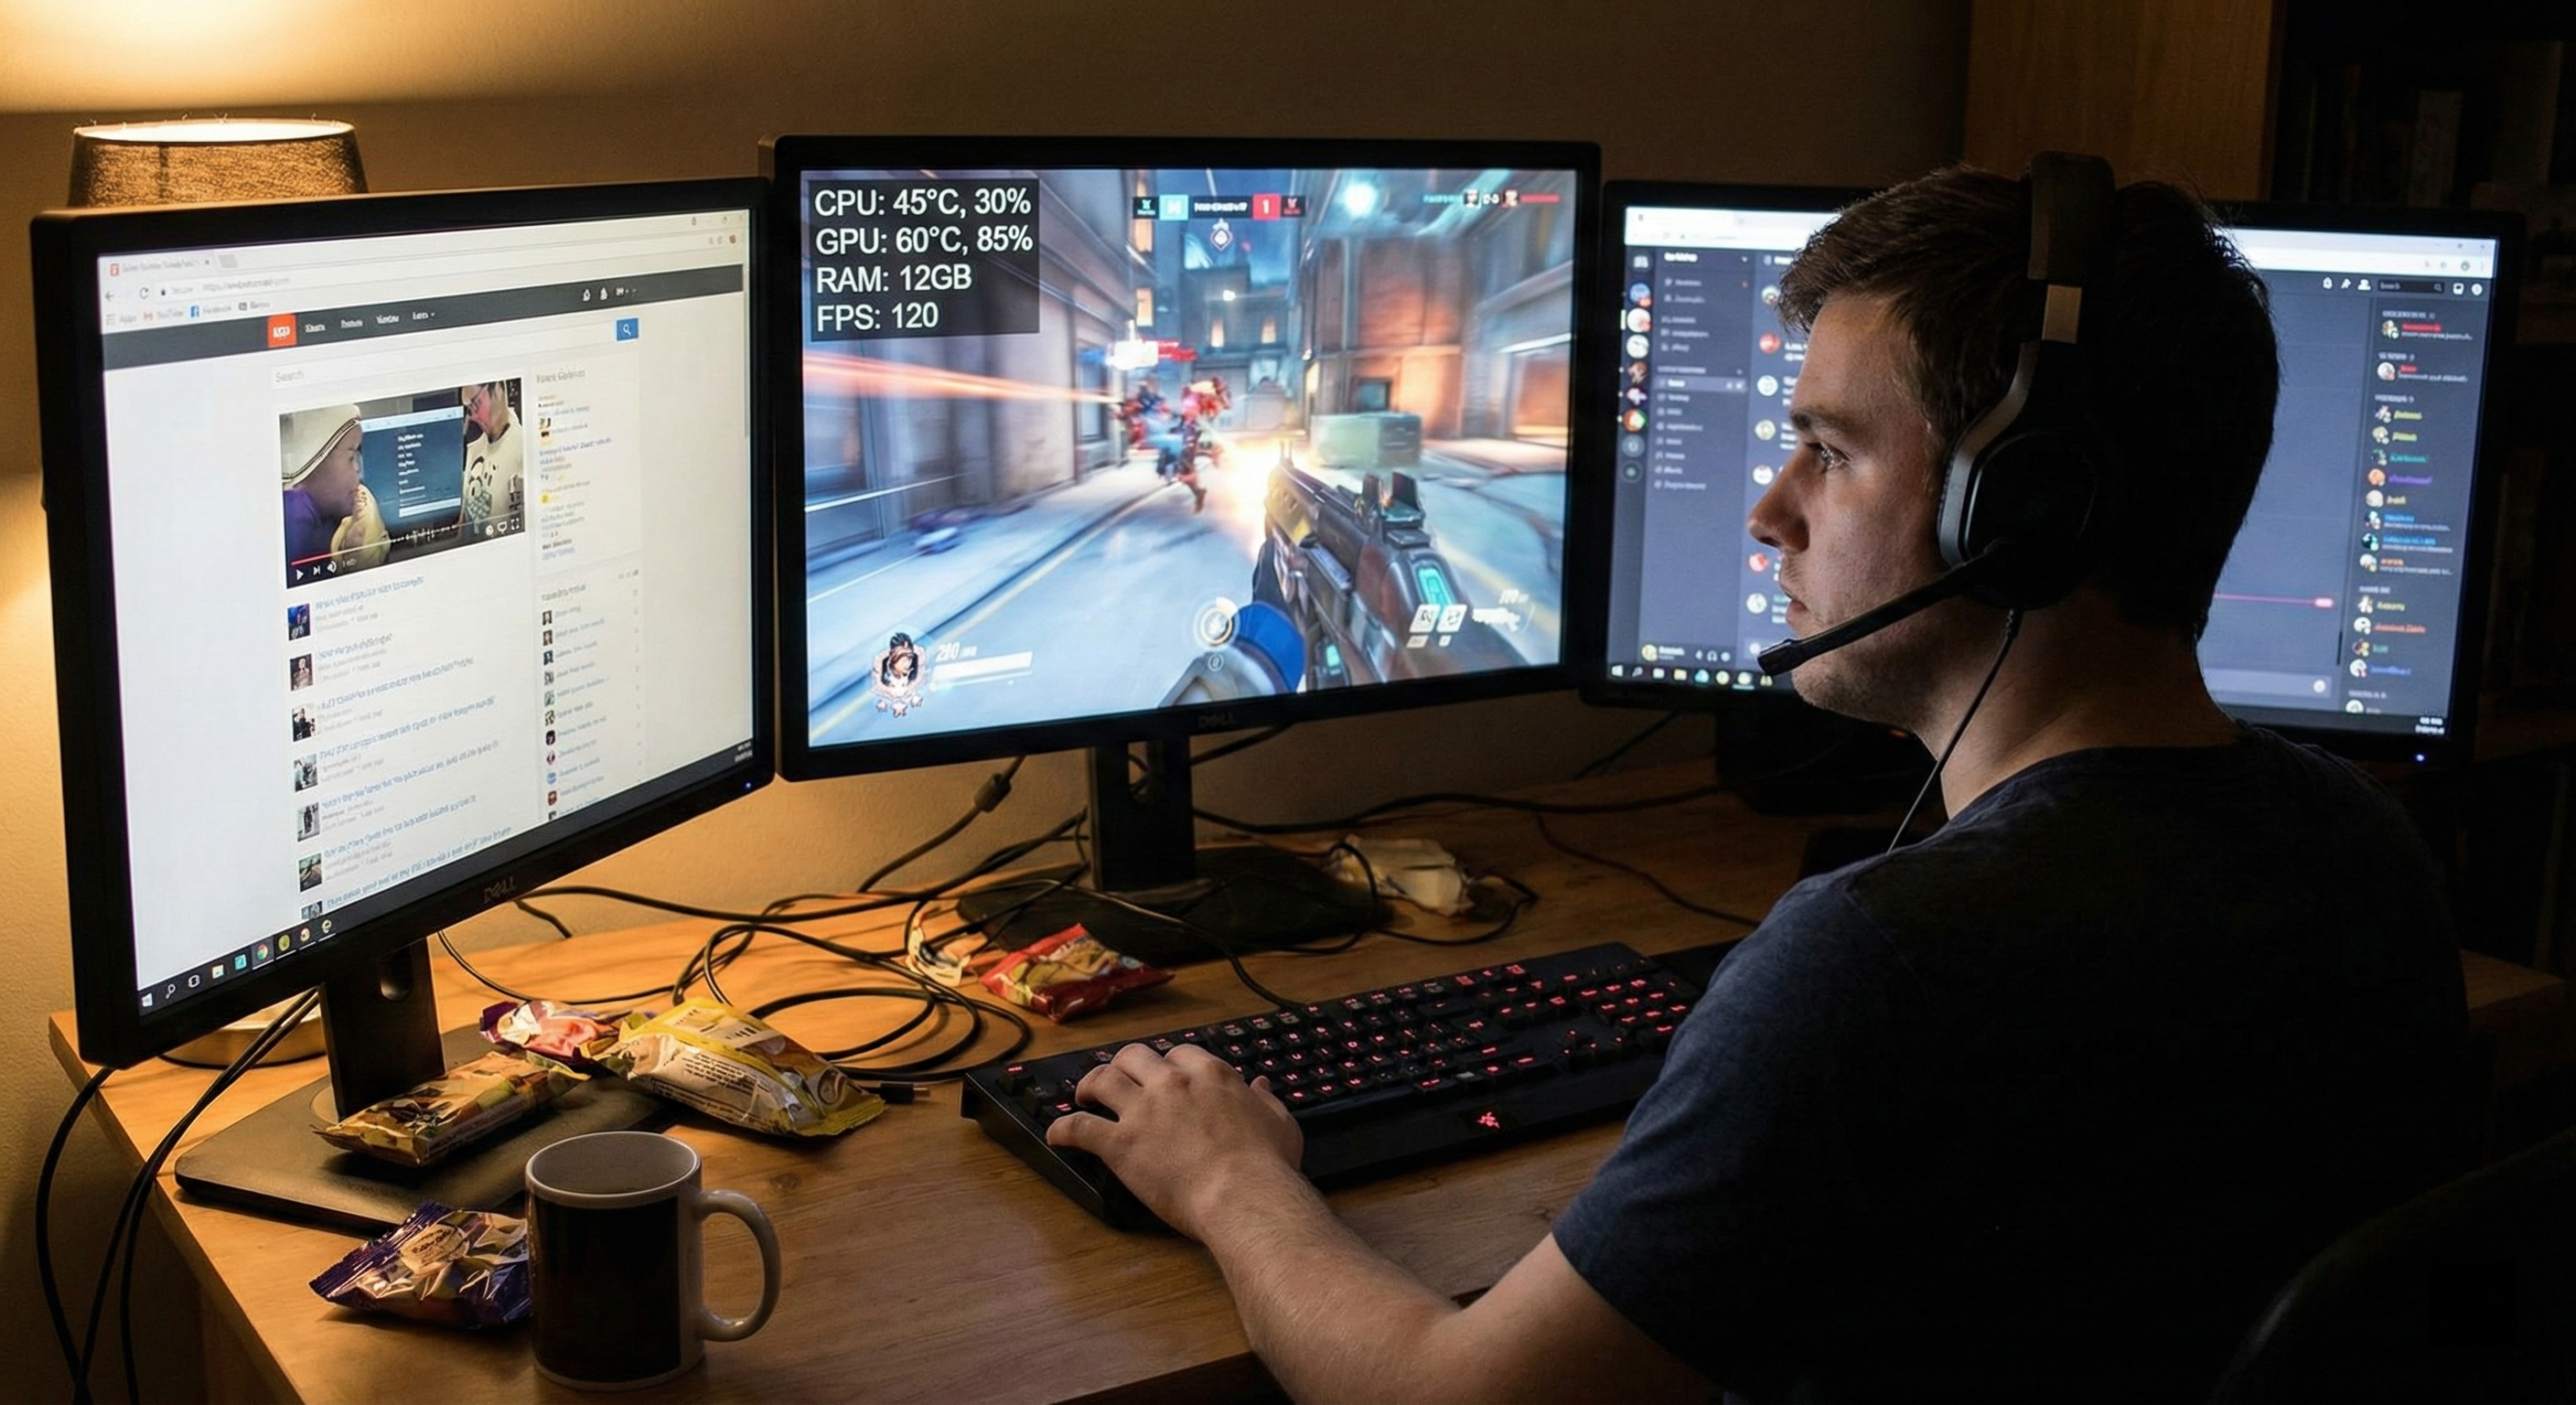
You know the feeling. You're lining up the winning shot, and suddenly—freeze. You're dead, the match is lost, and you're left staring at the screen. Did your internet lag? Is your graphics card dying? Or did your CPU just overheat?
Most gamers panic. They drop hundreds of dollars on a new GPU they don't actually need. But a smart PC user acts like a doctor first: diagnose the patient.
Learning how to monitor PC performance while gaming saves your wallet. By tracking the right numbers, you can pinpoint exactly why your game stutters. Is it heat? A memory leak? Or a hidden bottleneck?
Here is how to stop guessing and start fixing.
Key Metrics: What Should You Actually Monitor?
Seeing "120 FPS" in the corner doesn't mean your game is running smoothly. To truly master how to monitor PC performance while gaming, you have to look past the vanity metrics.
FPS vs. Frame Time (Understanding Smoothness)
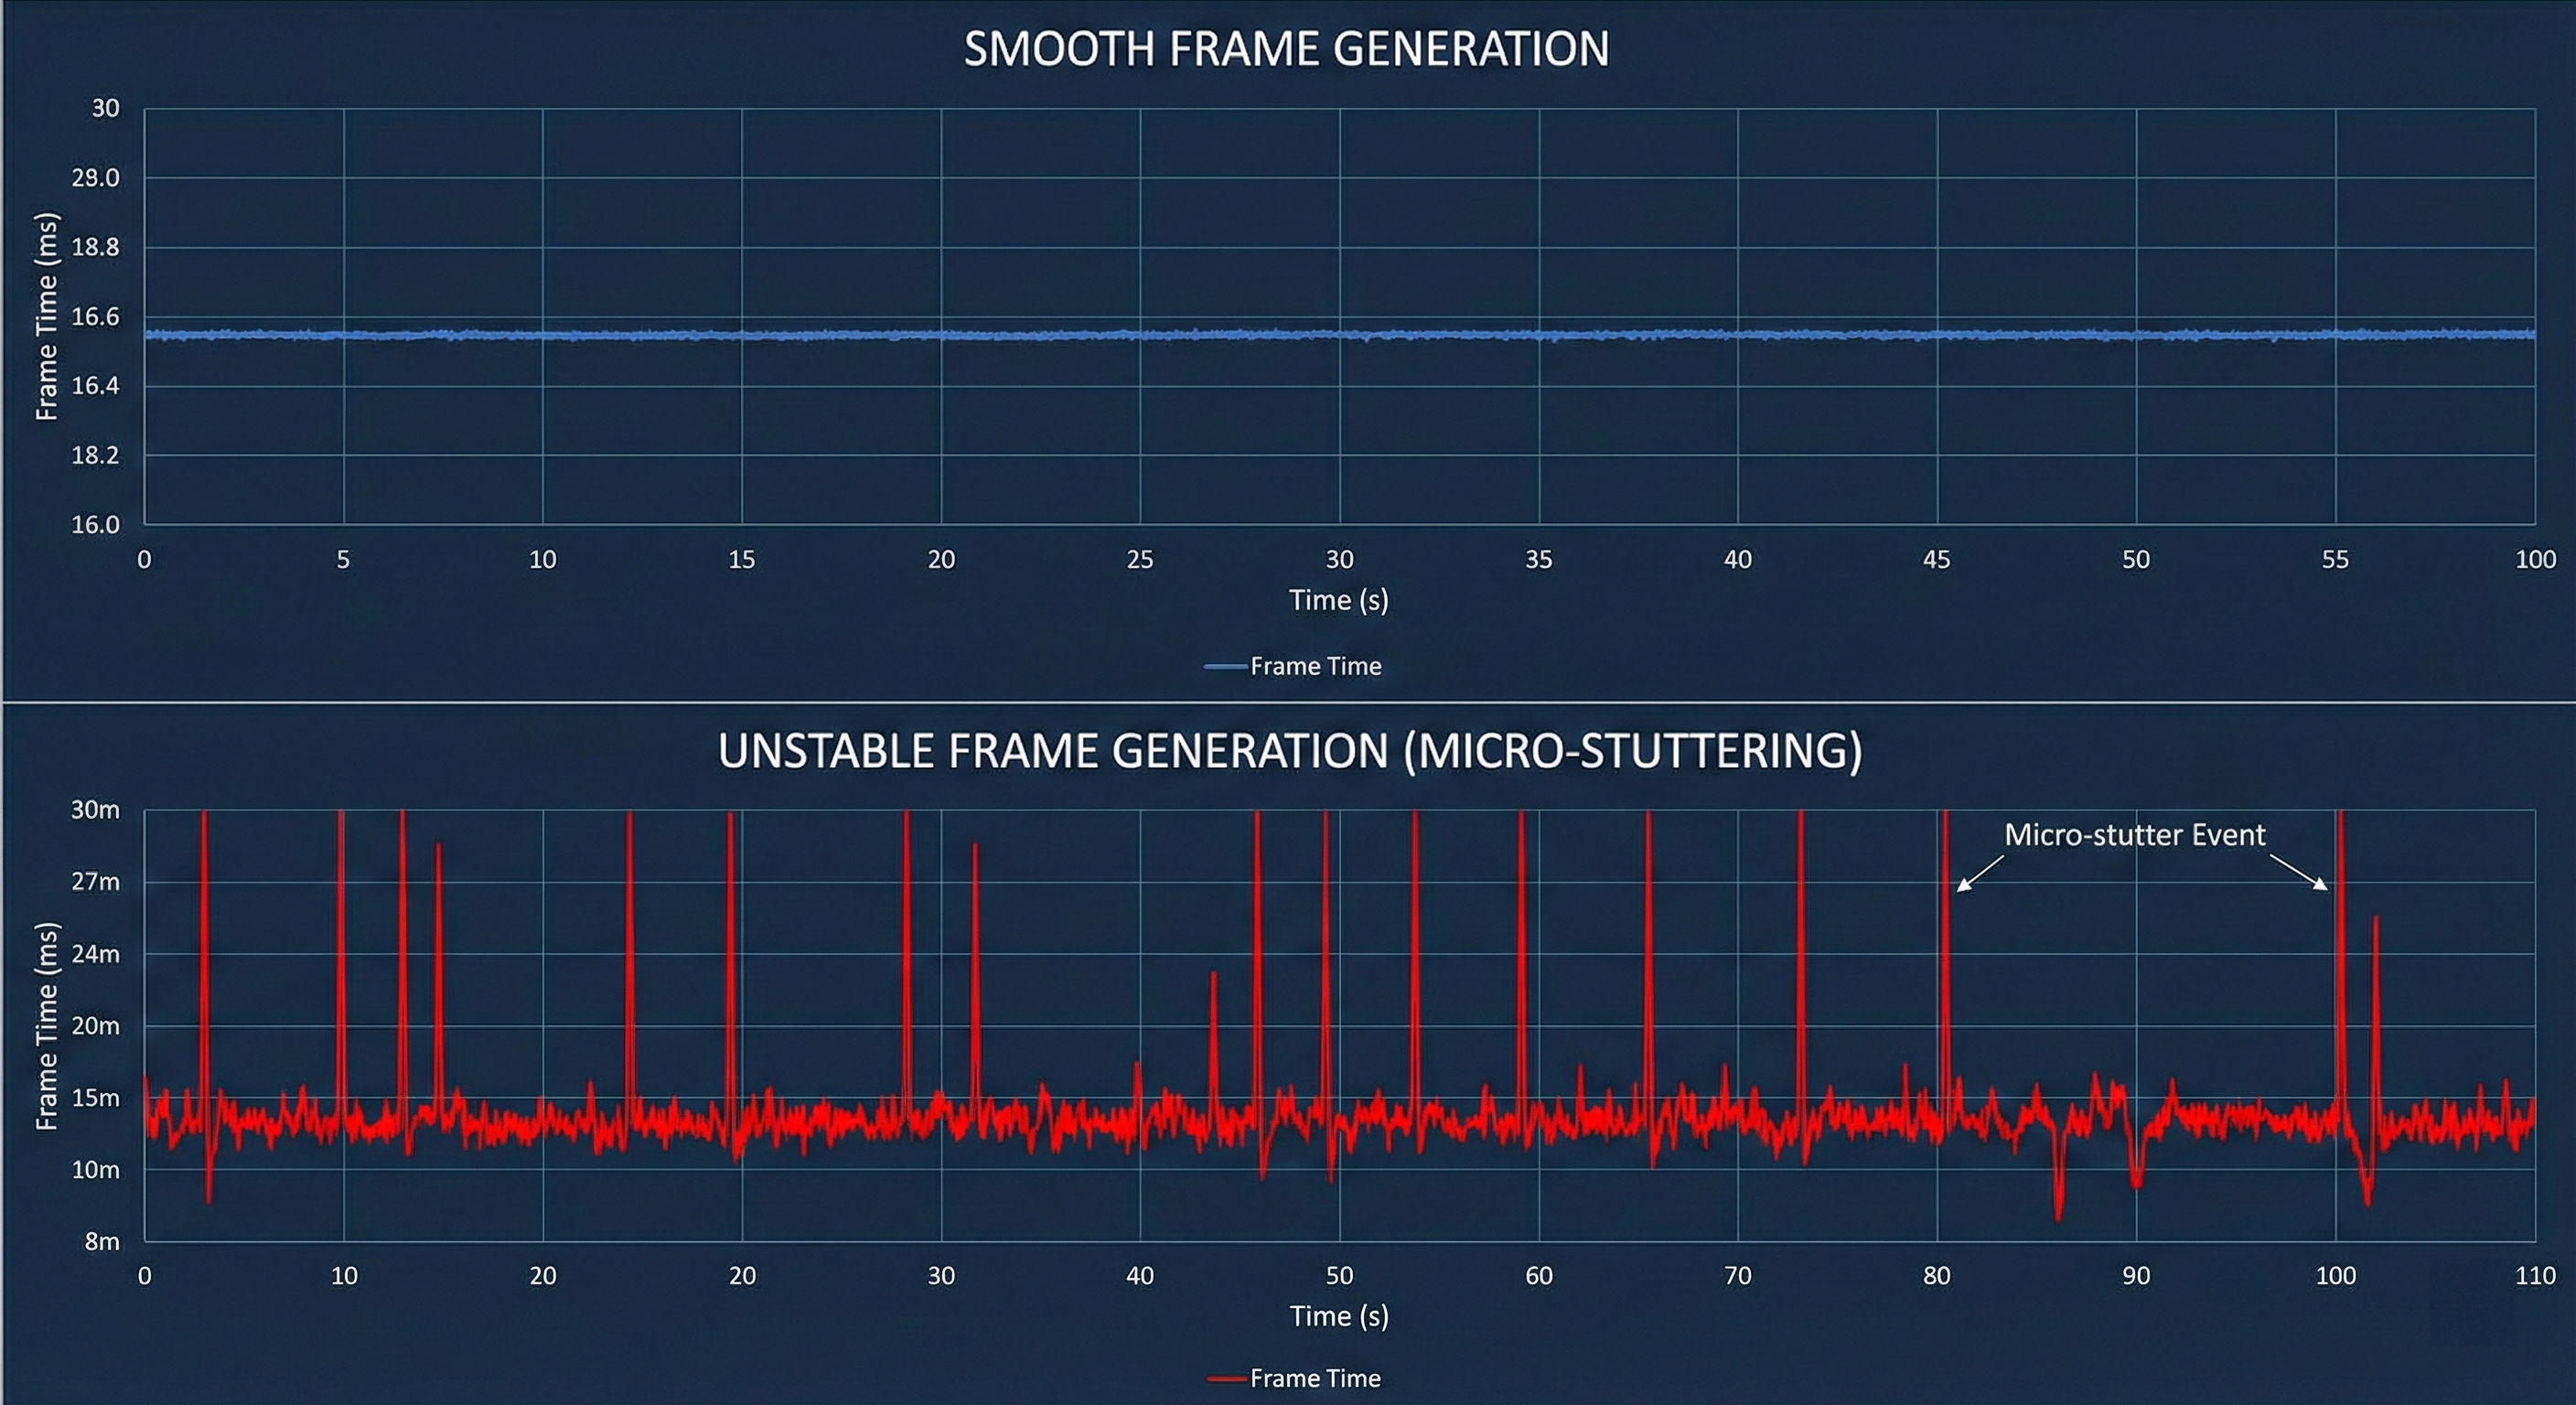
FPS (Frames Per Second) is an average. And averages lie. You can average 60 FPS while the game freezes for half a second every ten seconds. That is unplayable, but the number looks fine.
To catch the real problems, look at these:
- 1% Lows: This tracks your worst moments. If your Average FPS is 144 but your 1% Low is 20, that's why you miss shots. It measures the "micro stutters."
- Frame Time: This measures how long one frame takes to render. You want a flat line. For 60 FPS, you need a steady 16.6ms. Spikes on this graph mean lag, even if the FPS counter says otherwise.
CPU & GPU Utilization
Understanding usage percentages tells you which part is sweating and which part is sleeping.
- GPU Usage: You want this high. Ideally 95-99%. It means you are getting every dollar's worth of performance out of your card.
- CPU Utilization: This is tricky. You might see "Total Usage" at 50% and think you're safe. Wrong. Games rarely use all cores. If one single core hits 100% while the others idle, you have a CPU bottleneck. The total number doesn't matter; the maxed-out core does.
Temperatures and Thermal Throttling
Heat kills performance. When hardware hits its limit, it slows down to protect itself. That's called thermal throttling, and it feels like hitting a brick wall in-game.
Here are the safe zones for modern hardware:
| Hardware Type | Safe Operating Range | Throttle Limit | Notes |
|---|---|---|---|
| Intel CPUs (13th/14th Gen) | 70°C - 85°C | 100°C | Spikes to 90°C are expected behavior. |
| AMD Ryzen (7000/9000 Series) | Up to 95°C | 95°C | Designed to push thermal limits under load. |
| NVIDIA GPUs (RTX 40 Series) | 65°C - 75°C | ~84°C | Keep cooler for optimal boost clocks. |
RAM and VRAM Usage
If your system RAM hits 95-100%, Windows starts using your storage drive as memory. That is painfully slow and causes massive stuttering.
The same goes for Video Memory (VRAM). Try to run 4K textures on an 8GB card? The data won't fit. The game will hitch as it swaps files back and forth.
Top Tools on How to Monitor PC Performance While Gaming
You don't need expensive software to get gaming performance metrics. In fact, you probably already have the necessary hardware monitoring software installed.
Beginner: Manufacturer Overlays (NVIDIA/AMD)
- NVIDIA App / GeForce Experience: Hit Alt+R. It pops up a basic overlay. Just a heads up: Nvidia is moving everything to the new NVIDIA App, which might still have a few bugs compared to the old GeForce Experience.
- AMD Radeon Software: Press Ctrl+Shift+O. Honestly, AMD's default overlay is better. It gives you deeper data, including CPU junction temps, right out of the box.
The verdict: Good for a quick check. Bad for detailed logs.
Intermediate: FPS Monitor & Windows Game Bar
Windows has a built-in tool called Game Bar (Win+G). It's fine for a quick glance at CPU usage, but the graphs are weak. If you want something dedicated but don't want to learn a complex program, check out FPS Monitor. It's lightweight and customizable.
Advanced: MSI Afterburner & RTSS (The Gold Standard)
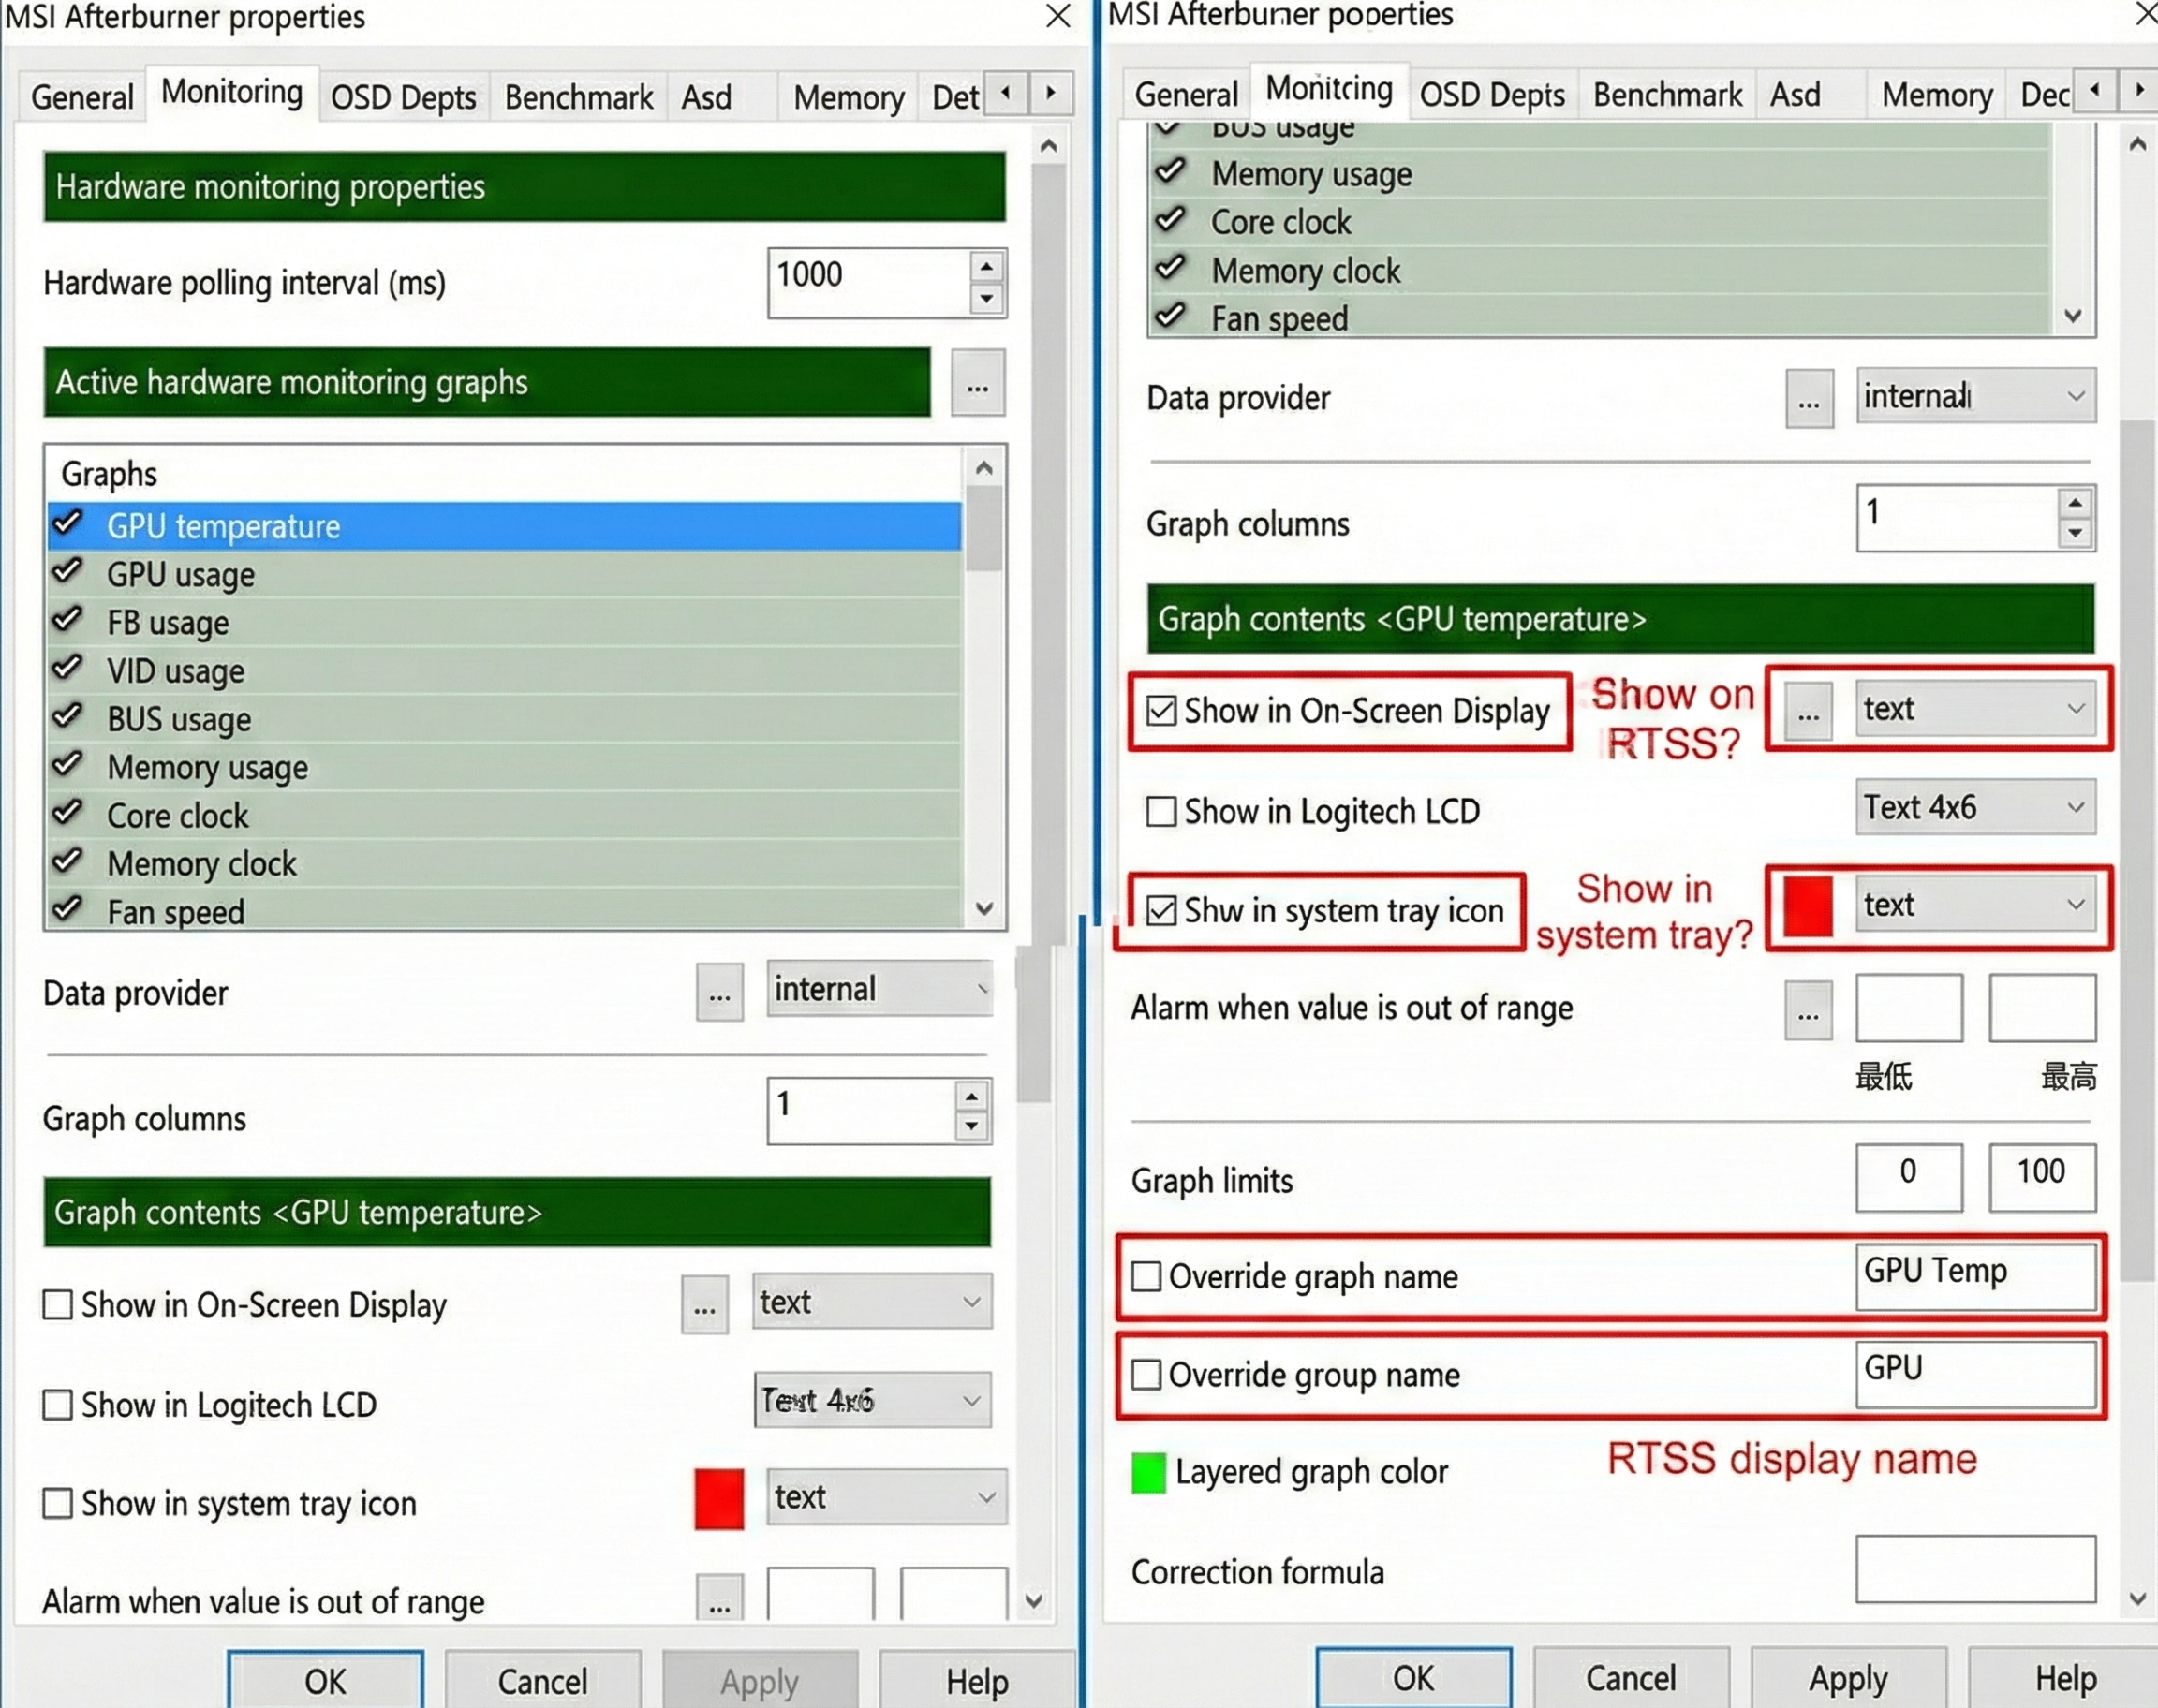
This is the king. MSI Afterburner paired with RivaTuner Statistics Server (RTSS) gives you total control.
You can toggle specific metrics—individual CPU cores, frame time graphs, voltages—and put them right on your game screen (OSD). Recent updates (Beta 4.6.6+) even support the RTX 50 series.

One warning: If you use DLSS 3 (Frame Gen), standard overlays often miss the AI-generated frames. Trust the game's internal counter or make sure your RTSS is updated to the absolute latest version.
Pro Tip: Want to get nerdy? Try Intel PresentMon. Its "GPU Busy" metric tells you exactly how much time the GPU spends rendering versus waiting for the CPU.
How to Analyze the Data: Identifying Your Bottleneck
You have the numbers on your screen. Now, what do they mean? When learning how to monitor PC performance while gaming, interpretation is key.
The "Rule of Thumb" for Bottlenecks
Play a heavy game with uncapped FPS and watch the load:
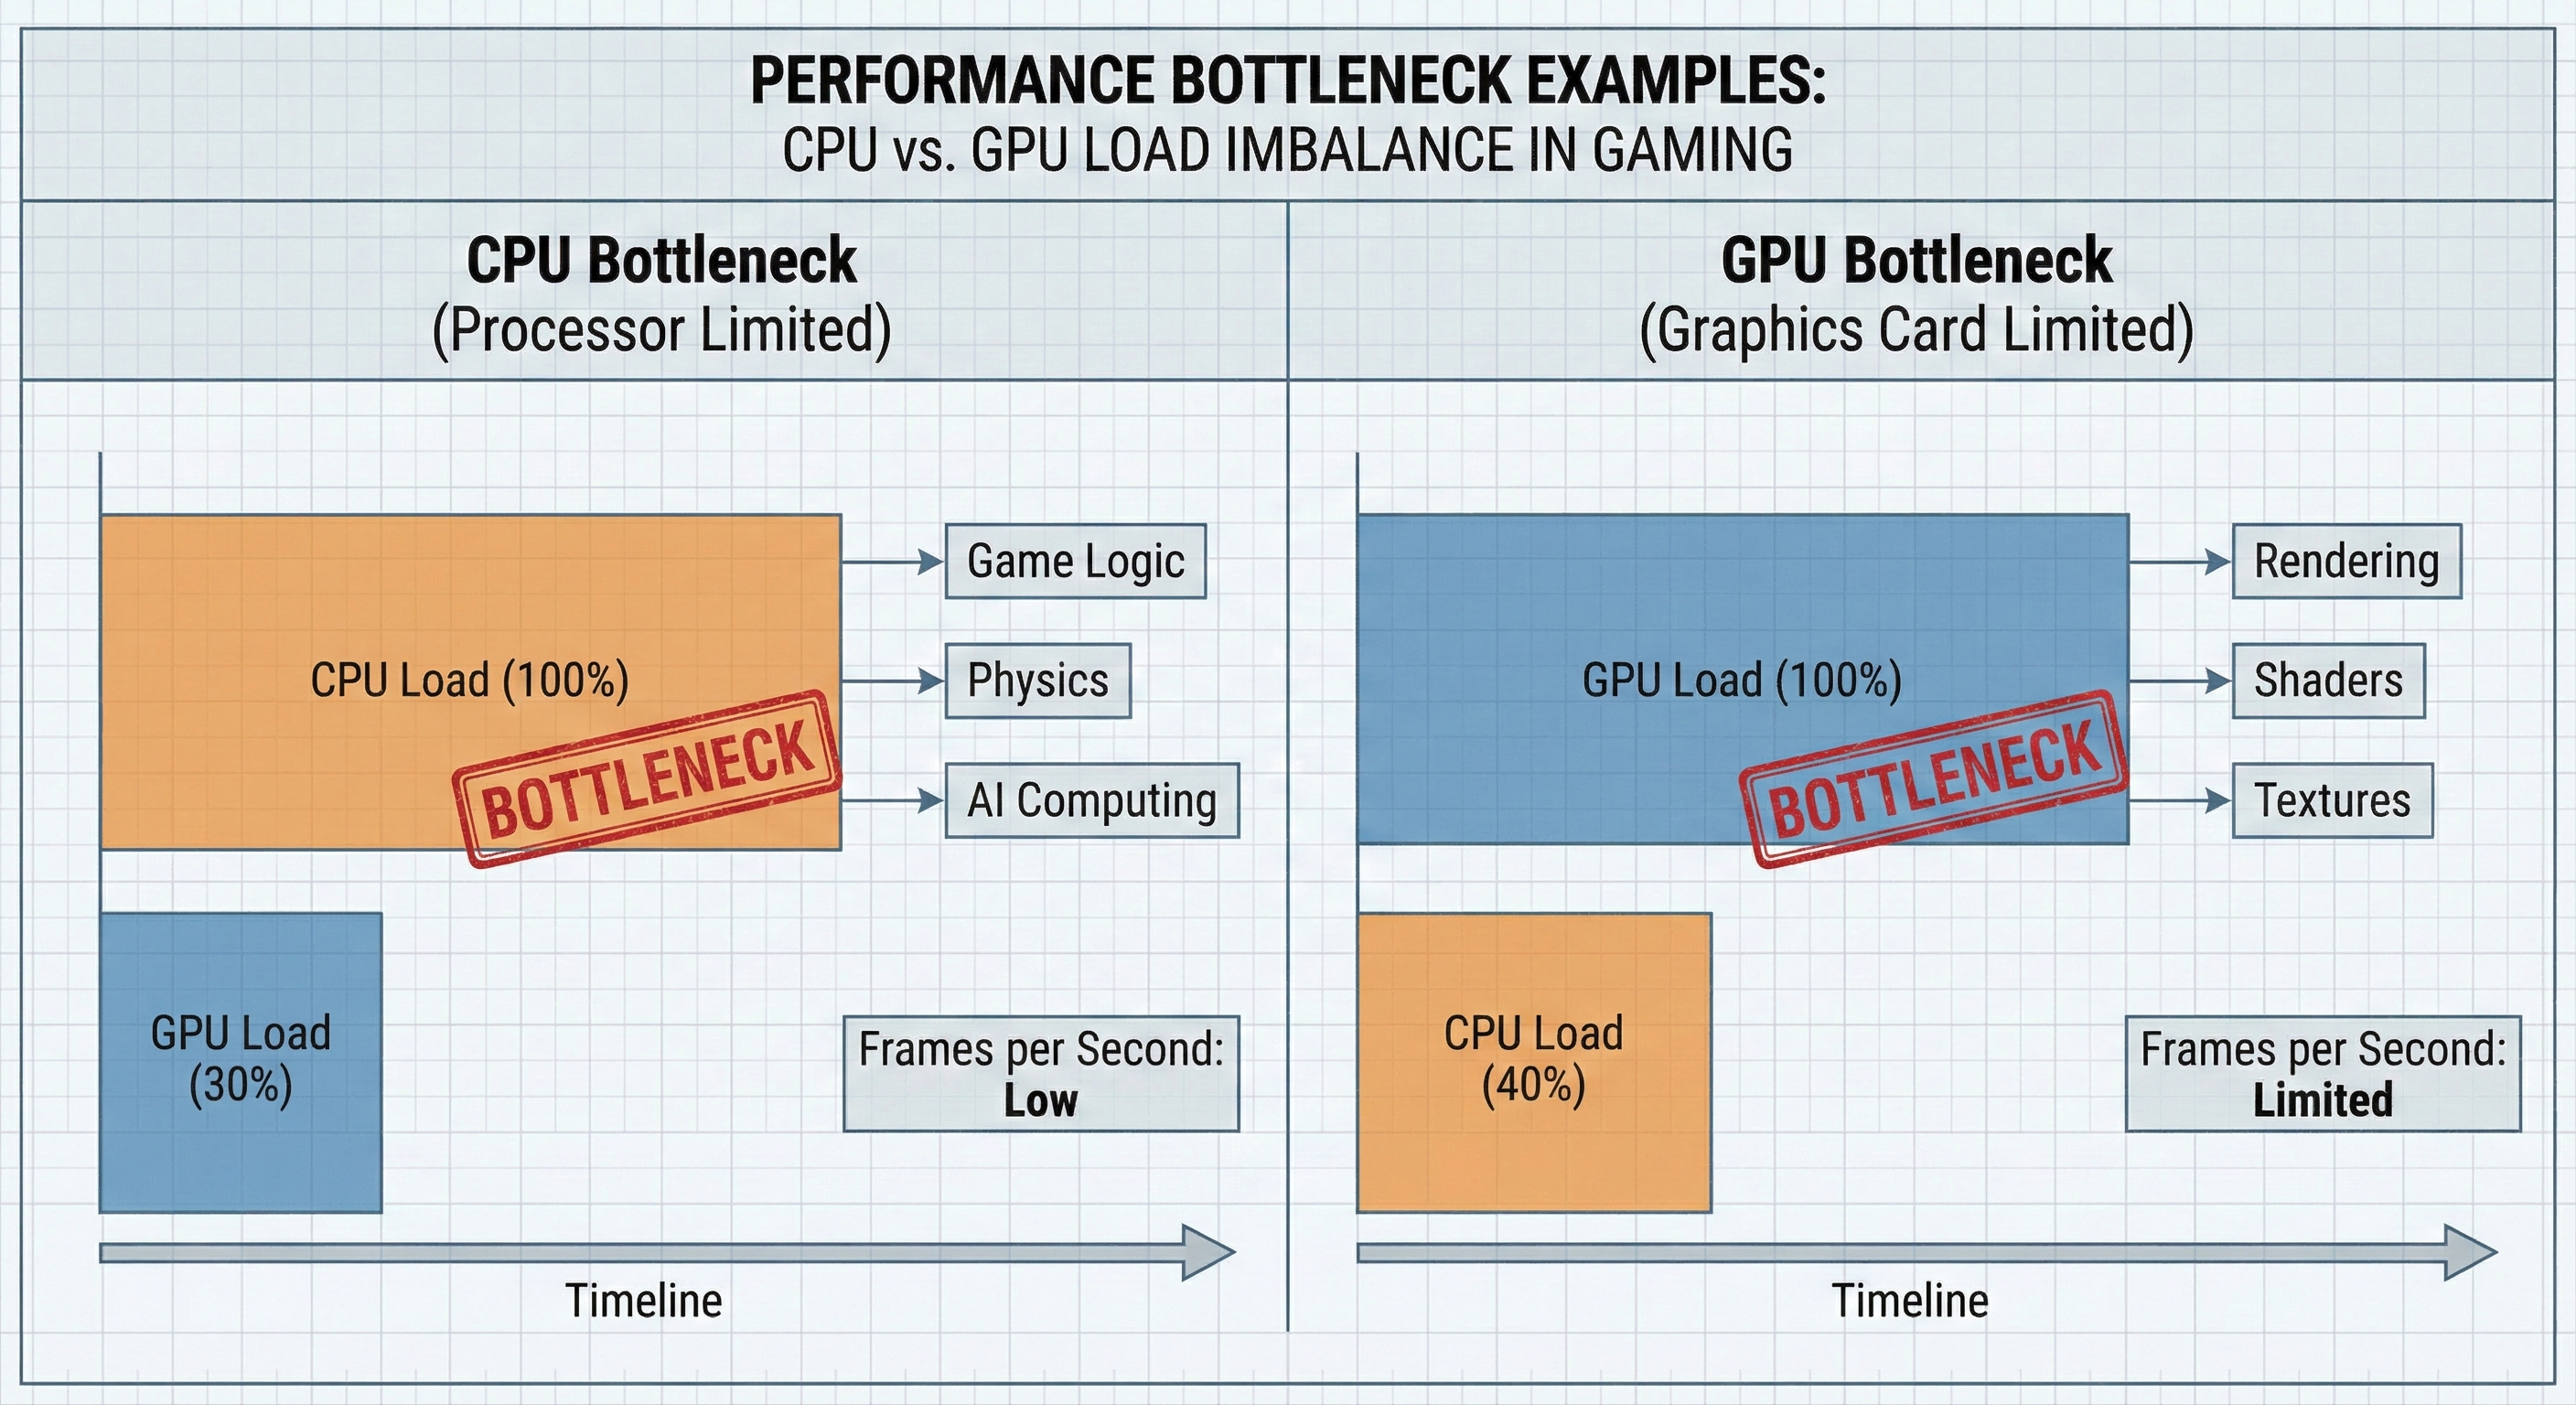
- GPU Bottleneck (Good): GPU is at 99%. CPU is chillin' (under 80%). This is ideal.
- CPU Bottleneck (Bad): GPU is slacking (60-70%) but one or more CPU cores are maxed out. Your expensive graphics card is waiting for the processor to catch up.
- RAM Bottleneck: Stutters happen exactly when RAM usage hits the limit.
The Challenge of Manual Analysis
Eyeballing this is hard. A "CPU bottleneck" at 1080p might disappear at 4K because the load shifts to the GPU. Plus, staring at tiny numbers while trying to play a competitive shooter is a recipe for disaster. You'll miss the spike during the explosion because you were too busy dying.
The Smarter Way: Using a Bottleneck Calculator
Stop guessing. Validate what you see with a calculator.
BottleneckChecker is a solid tool for this. You don't need to analyze milliseconds of frame time. Just plug in your specs—CPU, GPU, RAM, and resolution.
It calculates the balance of your build. Match that report with your live Afterburner numbers. If Afterburner shows low GPU usage and the calculator confirms a 25% CPU bottleneck, you can be confident that upgrading your processor is the right move.
Practical Fixes: Optimizing Your Gaming Performance
Identify the problem? Try these free fixes before buying new parts.
Software Optimizations
Start with your drivers. "Game Ready" updates often boost FPS by 10-15% in new titles. If you are GPU bottlenecked, go into settings and turn down Volumetric Clouds, Shadows, and Ambient Occlusion. These eat performance for breakfast with minimal visual gain.
And please, close your browser. Chrome tabs eat RAM. Even a high-end rig can stutter if you have 50 tabs open in the background.
Hardware Tweaks
- Fan Curves: GPU hitting 84°C? Use MSI Afterburner to set a more aggressive fan curve. It's louder, but your performance will stabilize.
- XMP/EXPO: Check your BIOS. Ensure XMP (Intel) or EXPO (AMD) is on. Running fast DDR5 RAM at stock speeds (like 4800MHz instead of 6000MHz) creates massive CPU bottlenecks, especially on Ryzen.
When to Upgrade Hardware
Software didn't fix it?
- Upgrade GPU: If you are constantly at 100% GPU usage, settings are low, and FPS is still trash.
- Upgrade CPU: If your GPU usage sits below 90% while your frame rates are low.
Conclusion
Monitoring performance isn't just about bragging rights. It's a diagnostic tool.
Watch your Frame Times and 1% Lows. Keep your temps safe. Stop guessing what's wrong with your rig. Use the data from MSI Afterburner and cross-reference it with BottleneckChecker to make smart choices.
Ready to find out if your CPU is holding back your new GPU? Try our free PC bottleneck calculator now for an instant report.
Frequently Asked Questions
How do I show FPS while gaming on PC?
The easiest way is using a built-in in-game performance overlay. NVIDIA users can press Alt+R, while AMD users use Ctrl+Shift+O. Steam also has a simple FPS counter in Settings > In-Game. For the best detail on how to monitor PC performance while gaming, download MSI Afterburner.
How do I know if my CPU is bottlenecking my GPU?
Unlock your frame rate. If your GPU usage is low (below 90-95%) but your FPS is disappointing or unstable, your CPU is likely too slow to keep up. This means the CPU is holding the GPU back.
What is a safe GPU temperature while gaming?
For modern cards, 65°C to 80°C is the sweet spot. Thermal throttling usually starts around 84°C to 90°C. If you hit that limit, your hardware will slow down to cool off.
Why is my FPS high but the game feels laggy?
This is usually caused by "micro stutter." Your average FPS looks good, but the Frame Time (the time between frames) is inconsistent. Check your 1% Low FPS stats; that number tells the real story of smoothness.
Does hardware monitoring software affect FPS?
Ideally, no. Good tools like MSI Afterburner or NVIDIA's overlay cost you maybe 1-2 FPS. However, running three different overlays at once will slow things down.
How to check RAM usage in games?
Use the Performance tab in Windows Task Manager on a second screen. Alternatively, set up the On-Screen Display (OSD) in MSI Afterburner to show "RAM Usage" directly on your game screen.
What is a good frame time for gaming?
Consistency is key. For 60 FPS, you want a flat line at 16.6ms. For 144 FPS, you want 6.9ms. A steady line is better than a jagged one, even if the average speed is slightly slower.
Is 100% CPU usage bad for gaming?
Yes. If your CPU hits 100% utilization, it has zero room left for background tasks or new game data. This causes input lag, freezing, and major stuttering.
How to use NVIDIA performance overlay?
Make sure you have the GeForce Experience or NVIDIA App installed. Press Alt+R in-game to toggle the overlay. To change what you see (like adding latency stats), press Alt+Z and go to Performance settings.
Can a monitor cause a bottleneck?
Technically, yes. If your PC pushes 200 FPS but your monitor is only 60Hz, you only see 60 frames. To actually experience the performance you are monitoring, your monitor's refresh rate (Hz) needs to match your FPS.